


Sony Group Corporation: Tech stocks can be undervalued too
A comprehensive view of Sony Group Corporation's fundamentals, future business prospects and its company valuation

Sony Group Corporation was established in 1946 as an electronics shop by Masaru Ibuka and Akio Morita. The company manufactured a variety of electronic goods including transistor radios, and was the first to produce a tape recorder in Japan in 1958.
 In The Vancouver Sun Newspaper, July 26, 1957 (46264879332).jpg - Wikimedia Commons")
Figure 1: Sony transistor radio advertisement, 1957 (Source: Wikimedia)
Today, Sony Group Corporation operates across the following segments: Game & Network Services (PlayStation hardware/software), Music (recorded music and publishing), Pictures (film and streaming), Entertainment, Technology & Services (electronics, cameras and smartphones), Imaging & Sensing Solutions (image sensors), Financial Services (insurance, banking), and Other (media manufacturing, storage). Sony’s biggest revenue generators are the Game & Network Services as well as the Entertainment, Technology & Services segments, together accounting for about 50% of the total revenue. Similarly, sales from the U.S combined with Japan accounts for more than half the total revenue. Sony’s recent revenue generation plan has been to focus on its gaming, streaming and music related services and products to promote growth. Over the past couple of years, the company has utilised acquisitions as a vehicle to capture growth within its non-financial segments such as entertainment and technology. For example, it has in recent years acquired notable market players such as Crunchyroll in the streaming industry, and Bungie in the gaming industry, respectively.

Figure 2: Sony Group Corporation Revenue Breakdown (Source: TradingView)
A cursory fundamental analysis reveals that free cash flow (FCF) has grown at an average of 10% Y-O-Y over the past 7 years. Moreover, when examining Sony’s return on invested capital (ROIC), one observes that it stands at a robust 10.2%. However, the weighted average cost of capital (WACC) as reported by Sony stands at 3% on average. The differential between the ROIC and the weighted average cost of capital tells us that Sony has successfully been able to generate net positive returns on the capital invested into the business.

Figure 3: Sony Group Corporation’s cash and short term investments (Source: TradingView)

Figure 4: Sony Group Corporation WACC (Source: Sony Investor Relations)
Additionally, the trend of rising debt over the last couple of years (barring the most recent) is a reflection of its growth strategy in the streaming, music and gaming segment through acquisitions. Sony’s total debt stands at $27 billion, whereas its cash and short-term investments remain at $15.23 billion. However, when one accounts for the $19.82 billion free cash flow, one finds the debt levels to be quite manageable. Furthermore, another positive aspect is that Sony has consistently rewarded its shareholders by issuing stock buybacks over the past few years while retaining a solid financial position. Given these factors, it is fair to rate Sony Group Corporation’s fundamentals as solid. This view is mirrored by a plethora of credit rating agencies as well, with Fitch rating it A- (positive outlook).

Figure 5: Sony Group Corporation’s total debt (Source: TradingView)
When valuing Sony Group Corporation’s stock we must consider a few key factors. Due to the mercurial nature of U.S. President Donald Trump’s stance on tariffs and Sony’s debt position, a discount rate of 10% (which is considerably higher than the U.S. or the Japanese treasury rate) is settled upon. As for the growth trajectory of Sony’s FCF, given the historic performance along with tempered expectations (due to uncertain global economic conditions) we are left with the following assumption: 3% decline in FCF Y-O-Y for the first three years, 5% growth in FCF in the 7 years following the decline. For the terminal growth rate, we use 3%, and we keep share count constant (though Sony has actually reduced total share count through buybacks).

Figure 6: Sony Group Corporation’s Free Cash Flow (Source: TradingView)
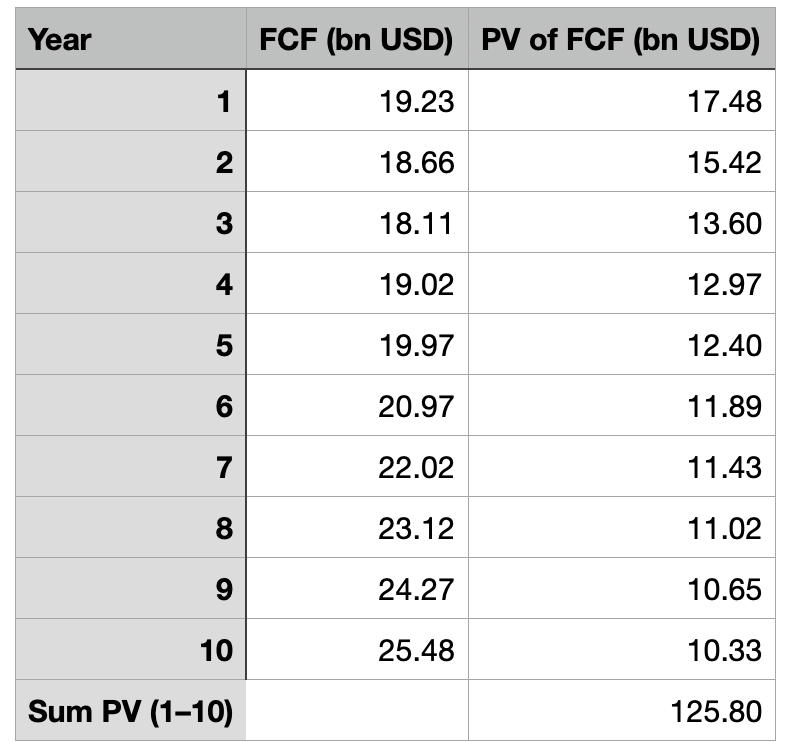
Figure 7: Sum of the present value of the cash flows of the 10-year period
The result of conducting a simple discounted cash flow analysis leaves us with a present value (PV) per share estimate of $41.07. Sony’s U.S. listing currently trades at $24.89, which implies that the stock is undervalued by about 64%. The stock has a P/E ratio of 19.8, and provides a dividend yield of 0.34%. Unless Sony sees a string of setbacks involving its latest ventures or suffers from prolonged and intense macroeconomic woes, we believe that the current differential between the share price and the intrinsic value offers a comfortable margin of safety. The current price of Sony’s stock along with its strong underlying business allows value investors to consider taking a position in this historic company.
Disclaimer
This Substack does not provide investment advice.
The author is not a SEBI-registered investment advisor.
The content in this article is intended solely for informational and discussion purposes. It is not a recommendation to buy or sell any financial instruments or other products.
Investors should seek personalized advice from their tax, financial, legal, and other advisers regarding the risks and benefits of any transaction before making investment decisions.
The information provided in this article is sourced from generally available information It may be incomplete or summarized.
Investing in financial instruments or other products involves significant risk, including the potential total loss of the invested principal. This article and its author do not claim to identify all the risks or key factors associated with any transaction. The author of this website is not liable for any loss (whether direct, indirect, or consequential) that may result from the use of the information contained in or derived from this website.
Kindly post more often in this place 🙂🙏